Bob’s Blog
We blow the lid off hidden conferencing fees
Among other things, I analyze, audit and negotiate contracts with virtually every major conferencing company on behalf of Optelcon’s clients. As such, I feel I have a good perspective on this topic. First, let me say that not all conferencing companies go out of their way to rip off their clients. In my opinion however, one of the largest conferencing companies has made hiding how much their services really cost an art form.
It Starts With The Contract.
When most attorney’s, or people in general, are presented with a contract to review, they naturally address what they see. The terms in the agreement are carefully redlined and negotiated. In the case of this vendor, the problem is not what is in the agreement, it is what isn’t that causes problems. Clients are presented with a 14-15 page MSA with all the legal terms and conditions one would expect for this type of service. The only reference to pricing however states that the customer agrees to pay the fees outlined in a separate order form. This comes later. We find that in most cases, master services agreements are reviewed by legal. Subsequent pricing sheets and order forms are not as heavily scrutinized and are left to the people ordering the service. At this point, price is what is being negotiated. This is where the bait and switch occurs.
The Order Form
The order form that is presented to the customer is typically a few pages long and contains the rates for the services the carrier chooses to display. Since it is just a pricing schedule, the fine print is rarely looked at. In a small box under the pricing schedule there are a few sentences that should have been included in the MSA but were conveniently left off. To paraphrase, this language states that the customer agrees to pay for all added fees and surcharges and that the customer agrees to the pricing and terms found in their standard pricing guide for anything not agreed to in the signed pricing schedule. This seems innocent enough until you see this carrier’s standard pricing guide. It is over 90 pages long and has terms and fees that few people would agree to if they saw it.
The Standard Terms
This 90-page document’s first paragraph states
Customer acknowledges and agrees that standard rates are subject to change at any time without Carrier X providing specific notice to customer by Carrier X posting new standard rates. Customer therefore agrees to check Carrier X’s standard rates from time to time and in each case prior to using any services subject to standard rates. Negotiated rates are subject to change at any time on thirty (30) days prior written notice to customer. Customer agrees that either or both of negotiated rates and standard rates may be increased by Carrier X by 15% each year without prior notice to customer. In light of the price changing policies herein, customer therefore agrees to carefully review each invoice prior to making payment and to notify Carrier X of any rate disputes within thirty (30) days from the date of the invoice, otherwise customer will be deemed to agree to such rates and to have waived any rights to dispute them if not raised within thirty (30) days from the date of the invoice.
There is no mention of these terms in the MSA. The customer unknowingly agrees to these and many other things by signing the order form. The carrier leaves it up to the customer to check their bill each month to see if the carrier raised their rates. If the customer doesn’t catch the changes in 30 days, there is nothing they can do about it. By paying the bill, a customer is unknowingly providing their tacit consent to the new higher rates. Not a single customer of ours knew this other agreement even existed. Aside from the annual increase that do not require notification, they can also change the contracted rates at any time with notice to the customer. The sketchy part is that this notice only shows up as a footnote on their paper invoice. The people paying the bills are unlikely to notice or understand the changes.
Misleading Surcharges
Another sketchy area is the significant “administrative” surcharges, call minimums and other charges. The way this carrier’s agreement works, if fees and services are not specifically called out on the order form, the customer unknowingly agrees to whatever is on the standard pricing guide. One example of this is call minimum charges. These fees are typically $15-$20/call. On larger customers, we don’t see this fee charged as much however, on smaller customers it is more common. On the Last Page of the standard terms you will find a section called “taxes fees and surcharges”. The non-governmental surcharges below are lumped together with the government mandated taxes. Most people assume that the surcharges are government mandated and that there is nothing they can do about them. Seriously, who looks at these? (We do) None of these surcharges have anything to do with any regulatory or taxing authorities.
Support Service Surcharge – 9% – This is nothing more than a profit enhancement fee and is not listed anywhere on the order form or MSA.
Telecommunication Surcharge – $.0027/min – This does not seem like a lot however, since the average contract rates are between $.0089 and $.011/min, this represents a 24%-30% markup.
These two hidden surcharges alone can drive up the contracted cost per minute by over 35% without the customer knowing it.
Carefully Designed Billing Reports
This carrier provides its clients with standard billing reports to review the costs and usage data. In my opinion, this carrier goes to great lengths to present the information in such a way as to hide what the services really cost. On one of the standard billing reports, this carrier displays the number of minutes and cost without the added surcharges and fees. This makes the rates match the price per minute from their order form. On another report the carrier shows the total costs including taxes fees and surcharges all lumped together. On this report they do not provide any of the detail that you would need to compute your effective cost per minute.
(For this example, the rate on the order form is $.01/minute) This is what shows up on the billing report:
200 calls – 10,000 minutes – $100 = $.01/min – You check your order form and determine you have been charged the correct amount.
The effective cost per minute, before govt. required taxes, is very different.
Call Minimums – 200 calls x $15/call = $3,000. These call minimums show up on a different report and they are listed as a “feature”. This makes it is difficult to link the two costs together.
Telecom Surcharge 10,000 min x $.0027 =$27
Service Support Charge – 9% x $100 = $9
The total effective cost for 200 calls and 10,000 minutes can be as much as $3,136 for an effective rate of: $.31/minute
If the carrier doesn’t charge the call minimums, the effective cost comes to $136 or $.0136/minute (36% higher than agreed to before govt. taxes)
The Invoice
The invoice also details the cost per minute without the added non-tax related surcharges. Throughout the detail on the bill, these charges are buried in a single line item for “State & Local Taxes and Fees”. Only on the last page of the invoice, (I’m not making this up), do you find a small section that specifies how much of the taxes, fees and surcharges are actually mandated by the Government. Below is the extent of the detail provided on the invoice. This is all you get. For this customer, the $46,000 in additional fees added 34% to their pre-tax monthly costs. As you can imagine, our client was not very happy to learn about these added charges. They were however grateful when we eliminated these added fees
TAX
Federal Taxes $0.00
State Taxes $1600.44
Local Taxes $1000.75
FEES
Federal Universal Service Fund Contribution $14,850.31
Telecom Surcharge $19,800.10
Service Fees $26,200.32
How to determine if your company is a victim to these added charges.
Using traditional methods, you will not likely find the answer to this question. This carrier does a brilliant job of keeping customers in the dark from the time they sign the deal to the time they get their invoice. Optelcon has developed systems and processes to bring these hidden charges into the light. You will only find them by requesting custom call detail reports with specific fields. Unless you know what fields to ask for, this carrier is not going to offer them up. Unless you know what fields to ask for and have a system that can link all of the charges together, it is unlikely you will find them on your own.
Can these fees be eliminated?
Yes, but not without a fight. Optelcon has been very successful in negotiating the removal of all these fees for our customers. Because we have set precedent with other customers, Optelcon is typically able to negotiate the elimination of these fees within 30 days. It helps when you have people on your team who used to work for the different carrier’s billing departments.
For a free evaluation of your conferencing or other IT and telecom costs, please contact us.
Pros And Cons of Different Consulting Fee Models (It is all about the incentives)
It’s basic human nature: people are typically driven to do what rewards them the most. This could mean giving back to the community or contributing to the betterment of the human race.
For a business to achieve its goals, incenting employees and vendors correctly is critical. Employees’ and vendors’ goals of success must be in alignment with that of your business’s objectives. If aligned correctly, your employees and vendors will do what is best for themselves, and in doing so, your company will thrive.
The question is then, how to best align the goals of your vendors with that of your profitability goals? When engaging a consulting firm to help improve your company’s profitability, it is vital to understand what their own business drivers are.
There are many ways for consulting companies to bill their clients:
Fee Type |
Profitability Drivers and Key Incentives |
Alignment With Your Company’s Profit Goals |
Predictability | Guaranteed ROI and Increase In Profit |
Risk | Service Is A Profit Center |
| Fixed Fee | Minimize Internal Effort | Limited | High | No | Yes | No |
| Hourly | Maximize Billable Hours | Limited | Medium | No | Yes | No |
| Success Fee | Client Profitability | 100% | Low | Yes | No | Yes |
Although it can be difficult to forecast what you may pay a company with a success fee model, the trade off is better results. Paying your consultants success fees are the only way to truly align your company’s business objectives with those of your vendors. Since the time, investment and effort risk is primarily in the hands of the consultant, not many will charge in this manner. Even fewer companies will only charge clients after the benefit has been realized by their clients. Many charge based on an estimate of savings upfront.
Optelcon is one of the few consulting companies that charges a success fee after the benefit has been received. Optelcon takes the risks because we are confident in our ability to deliver added profits. Your company’s real benifits are:
- A vendor that is a profit center
- A cashflow positive fee structure (fees are charged only after clients receive benefit)
- Converts other vendors’ spend directly into increased profits
- For $3 dollars added to profits only $1 is charged
- Requires minimal internal effort
- Increases Productivity
- Improves Vendor Relationships
- Requires no systems to implement
If working with a company that provides these benefits is something that interests you, please contact us today for a complimentary review of your IT spend.
How Much of Your Mobile Data Usage Is Excessive? Tips to Reduce Your Company’s’ Mobile Data Costs.
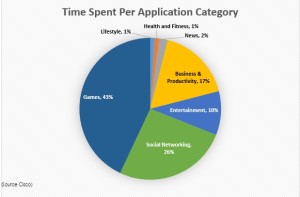
With Smartphones getting smarter and networks getting faster, using your phone to video chat, stream music and binge watch on Netflix is getting easier and easier. In 2012, the average data usage per person was 201MB. In 2015 this number exploded to 1.8GB (A 900% increase). By 2018, this number is expected to exceed 4.7GB/user/month. How people used their phones is equally dynamic. In 2012, people spent an average of 63% of their time using business related apps such as email etc. In 2015, people spent a total of 17% of their time using business and productivity apps. 83% of their time was used on data hungry, non-business related apps.1 The diagram below shows how people use their mobile devices today.
Per Employee, How Much Is Too Much Data Usage?
If your company is paying for your employees’ data, how much data should an average employee use each month on business related applications?
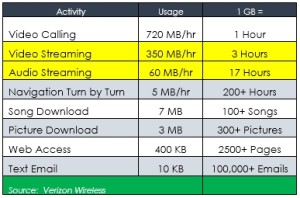
Although the cost per GB has decreased, the demand has increased and is projected to continue to do so. Aside from blocking all non-business related applications, here are some easy tips that can minimize your employees’ data usage and your company’s costs.
Tips To Reduce Your Employees’ Data Usage.
By changing the following settings in your employee’s mobile phones, your company will significantly reduce your data usage and your company’s mobile costs.
1. Always use Wi-Fi when available
It is easy to automatically connect to a secure Wi-Fi network at home or at the office. Just go to your device’s settings, make sure your Wi-Fi is on and log on to the wireless network. Your device will remember the network and log on automatically whenever it’s in range.
2. No video or music streaming unless you’re on Wi-Fi! NO large files.
Media streaming can easily be the most draining activity for your data plan, and you should absolutely avoid it if you’re not connected to a Wi-Fi network.
3. Monitor and turn off data hungry apps
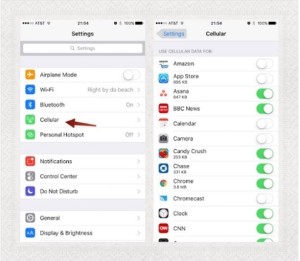
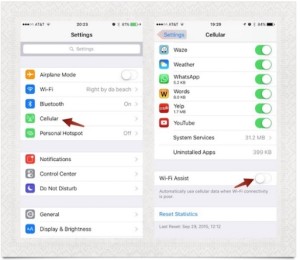
Be sure to prevent unnecessary data hungry apps from using cellular data. On an iPhone, go to Settings – Cellular and toggle them off one-by-one.
4. Shut off your apps
Closing apps when you’re done using them can also reduce data usage. Many open apps—especially those that provide location services—will continue sending and receiving data even when your phone or tablet is locked. This not only wastes data, but can also drain your battery. On an iPhone double click the home button and flick away apps to shut them.
5. Disable Wi-Fi Assist
When trying to supplement a weak Wi-Fi signal, Wi-Fi Assist uses Cellular Data to help with bad service. While this does help, you could unknowingly be using a bunch of data. To disable the feature on an iPhone:
- Open the Settings app and find Cellular.
- Scroll to the bottom and slide the toggle for Wi-Fi Assist OFF.
6. Disable Background App Refresh
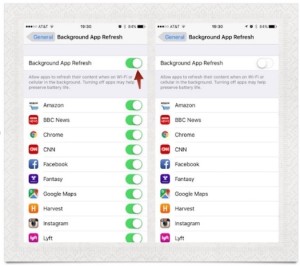
This is a very common trick to save on data. Apps can update in the background, while you are not using them and this, of course, consumes data. This can be disabled and won’t really affect how you interact with your phone. It also saves battery. On the iPhone:
- Go to Settings -> General and find Background App Refresh.
- Open the menu and disable the function at the top. The apps will go from green to blank.
- You can review the list of apps that had Background Refresh below the toggle.
7. Customize your phone’s auto-backup settings
All popular smartphones these days have features for automatically backing up your data. While this can be great, you should check your relevant app’s settings as soon as possible, and customize them so the app is only allowed to use Wi-Fi for uploading backups.
8. Disable Automatic Downloads on Cellular Data
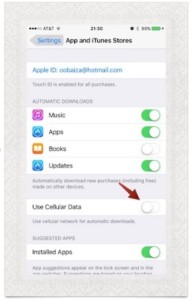
Automatic application updates can use a lot of cellular data. Instead, wait until you are connected to Wi-Fi before downloading and updating your apps.
- In Settings find App and iTunes Stores.
- In the Apps and iTunes Stores section, you’ll see Use Cellular Data. Turn this off and you’re good to go.
9. Disable Video Autoplay on Cellular Network
Some social apps such as Facebook and Twitter have a feature which auto plays videos automatically using a lot of data. To disable Facebook, for example, on iOS devices, go to Settings > Facebook > Settings. Under the Video section, turn on “Auto-play on Wi-Fi only.” On Android devices, go to App Settings from within the Facebook app, then check the box next to “Auto-play videos on Wi-Fi only.”
- Turn Off Cellular Data Usage for iCloud
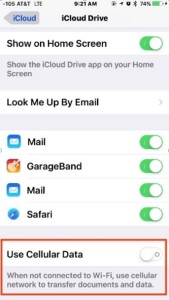
If you use iCloud to move files back and forth between devices, this could lead to higher than usual data usage. Turning this off can help:
- Open Settings and go to iCloud.
- In the iCloud section tap on iCloud once more
- Scroll to the bottom and disable “Use Cellular Data.”
- Last Resort: Avoid using cellular data completely
As a last resort you can turn off cellular data completely.
- Settings -> Cellular
- Turn Cellular Data OFF.
For assistance with these tips and others to reduce your mobile spend, please contact Optelcon at:
Mobility Operations and Customer Care
Email: Email: Mobile Operations
Phone: 877-574-7566
Web: www.optelcon.com
Is Apple taking BYOD to the bank at your company’s expense
Angry Birds, Kool-Aid And The Consumerization Of IT
Back in 2011, Apple coined the phrase the “consumerization of IT”. Today it is just known as BYOD “Bring Your Own (mobile) Device”. Back then, Enterprises would issue their employees devices like flip phones or Blackberrys. In 2011, Apple was already on its 2nd gen phone. The roots of the BYOD movement can actually be traced back to the creation of the App Store. This new concept allowed users to download (productivity) apps like Angry Birds. As the most downloaded iPhone app ever, one could argue that it was addictive games like Angry Birds that really started this revolution. (Come on. You know you played it…) Like a thunder-clap, every research company and news organization started drinking the proverbial Kool-Aid. Before BYOD was really even a “thing”, article after article touted how much money companies were going to save by letting the employees deal with their own mobile phones.

But At What Cost?
Aberdeen conducted a study regarding how cost-effective it was for companies to shift to BYOD. They found that companies with 1,000 BYOD phones spent an average of $170K/year more than organizations that maintained a well controlled corporate environment. The costs where actually shifted to other parts of the organization. The central cost of processing 1-2 invoices shifted to processing 1,000 expense reports. In addition, the IT support costs of managing and securing company data on BYOD devices actually increased. The cost of the equipment decreases comes at the expense of higher service and administrative costs.
Follow The Money To The Bank
How did this happen? It is often said that if you want to find out whodunit, you should “Follow The Money”. If you find out who benefited the most financially, you will likely find your answer. For Apple and others, it’s all about turnover and how fast they can get people to upgrade their old phone to the newest models. It is simple math. Individuals upgrade their mobile phones on an average of 18-20 months. Companies take an average of 28-32 months before they will allow employees to upgrade their phones. Improving turnover by 10-12 months means Billions in additional revenues for Apple and other phone manufacturers. Is it any wonder that Apple and device manufacturers are BYOD’s biggest cheerleaders?
The Tipping Point
According to Gartner, by 2017, over 50% of companies will require that employees use their own devices. BYOD is here to stay.
Best Of Both Worlds

It is possible to get the best of both worlds. One of the latest strategies is to issue corporate SIM cards to employees that are linked to the corporate account. These SIM cards are sent to employees who simply put them into their own devices. There are several advantages to this strategy.
- Employees get the latest and greatest device when they want at their own expense
- Companies retain the company phone numbers after an employee leaves.
- If an employee leaves the company, the employee just swaps out the SIM card to a personal number.
- Companies maintain phone records for compliance purposes.
- Companies save money by maintaining the larger corporate discounts and less expensive plans.
- Expense reports are no longer required. All the charges come in on one bill.
- Lowest cost overall – No equipment charges, lowest plan and administrative costs.
Maximizing Cost Reductions And Achieving Balance

When enterprise companies bring Optelcon in to analyze their mobility spend, our clients’ average domestic monthly smartphone service spend is between $75-$100/month per device. Given this fact, it is easy to see why the idea of giving employees a $50-$75/month reimbursement makes sense. After (re)negotiating our clients’ mobile agreements and optimizing their rate plans, the cost of these same service plans drop to an average of less than $50/month; even less for tablets and Wi-Fi devices. Without the cost of equipment, this hybrid strategy provides the lowest cost without the issues of letting employees own the services plans.
If your company’s average cost per mobile device is higher than $50/month, please contact us for a complimentary corporate mobility spend analysis. You have nothing to lose but wasteful and unnecessary costs.
Click Here For More InfoSIP Simplified. How many SIP trunks does your company need?
WHAT IS SIP AND WHY DOES IT MATTER?
SIP (Session Initiation Protocol) is an internet protocol like HTTP. SIP makes it possible to securely connect voice, video and data calls through the internet or private cloud based network.
THE BASICS
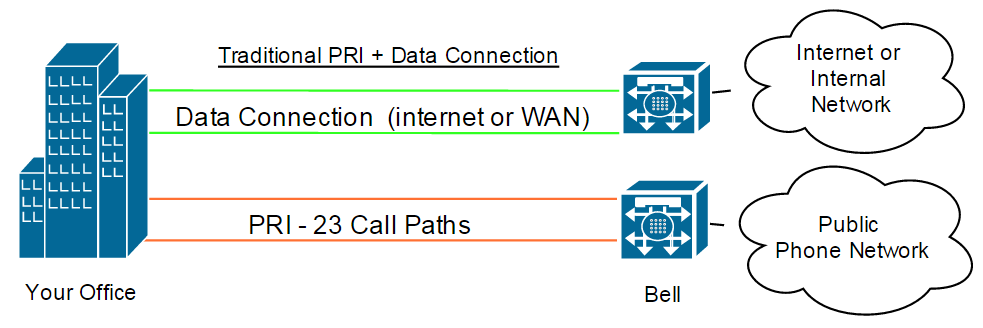
The number of PRI/T-1’s or POTS lines decide how many concurrent calls or (call paths) you can make between your company’s PBX and the PSTN (Public Switched Telephone Network); through the Bell Central Office. In the example below 2 PRI (23 call paths each), would need to be purchased. (See below).
THE NUMBERS
The following table provides the average ratio of SIP trunks per user across multiple business types. Each company is different however. A manufacturing company may only need a 10% ratio where a call center or brokerage firm may need a 90% ratio.
| Users | Avg. SIP Trunks Needed | Ratio |
|---|---|---|
| 5 | 3 | 60% |
| 10 | 5 | 50% |
| 50 | 20 | 40% |
| 100 | 35 | 35% |
| 250 | 80 | 32% |
| 500 | 150 | 30% |
| 1,000 | 280 | 28% |
| 5,000 | 1,000 | 20% |
In the old days, people used Erlang formulas to calculate trunk requirements.
Thankfully these calculators can be found on a number of websites. Here is a link to one of them. PBX Channel Calculator.
WHY DOES THE RATIO OF TRUNKS GET SMALLER WITH MORE USERS?
If you have a 2 person office, it is likely that both users could be on calls at the same time. You would need a 1:1 ratio or 2 trunks. If you have an office of 10 people, typically only 60% of the people may need to be on concurrent calls. And so on… As your population gets larger, statistically the % of people on the phone declines.
HOW DOES SIP WORK IN A MULTI-LOCATION ENVIRONMENT?
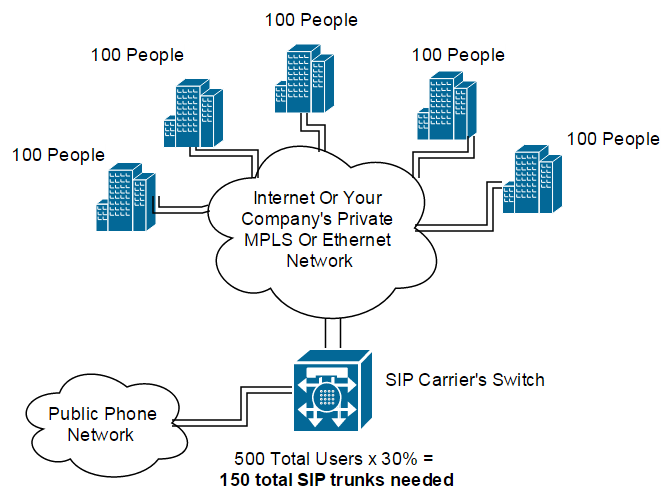
I will use the following example of a company with 5 offices, each with 100 people.
Using traditional methods, your company would have to install, and pay for, 2 PRI (46 call capacity each) for a total of 10 PRI and a call capacity of 460 concurrent calls. This is wasted spend. SIP providers aggregate all of your calls to the PSTN using their own switch. By aggregating these calls, your company can apply the trunk ratios based on the total of all users, from all locations. In the case above, instead of paying for 460 trunks using PRI, your company may only need 150-200 SIP trunks. This represents a significant savings.
HOW DOES MY COMPANY CONNECT TO A SIP NETWORK?
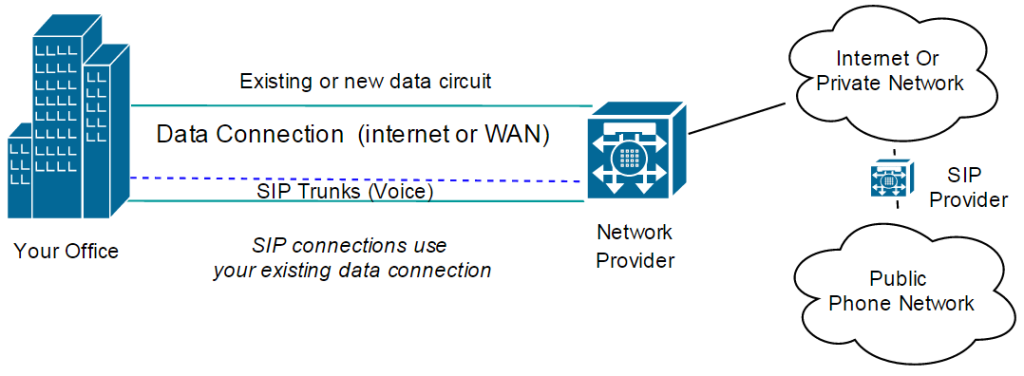
Companies that use PRI’s typically need two different connections. The PRI for voice and a separate data connection for the internet or private network. SIP can either be provided as a separate data connection from the SIP provider or can be delivered using your existing internet/private network connection. This eliminates the need for two separate circuits. To ensure voice quality, a (fast lane) is established inside your data connection. This means that spikes in data will not take away bandwidth from the SIP lane. This prevents the garbled or digitized sound that was prevalent when Voice over IP first came out. You may however, need to increase bandwidth to accommodate the additional voice calls. Given the low-cost of bandwidth today, it is typically still more cost-effective than a PRI + Data connection.
Buying SIP services does not come without risks. At 10,000 feet, things seem pretty simple. At 1 inch, things can get complex. When it comes to selecting a SIP vendor, it is important to choose the right features, technical specifications and to negotiate the right terms and pricing. Since no company is going to highlight their weaknesses, it is best to work with a company that has had real world experience with these services and companies.
For further information and/or a complementary evaluation please contact us.
Contact UsIs Your Company Paying Microsoft Too Much?
IS YOUR ENTERPRISE PAYING MICROSOFT MORE THAN NECESSARY?
In any dynamic organization, license consumption, new products, new releases, cloud solutions and IT infrastructure rapidly changes. In the “old days” (more than 5 years ago), Microsoft did not have many true (Credible Threats) to applications like Windows, Outlook and Office; to name a few. Without any real competition, Microsoft considered their customers, “Captive” and thus had little incentive to negotiate.
Fast Forward. In the last 5 years there has been an explosion of cloud based platforms from big and small software providers. Never before has the number of licensing and vendor options changed so dramatically. For the first time, there are now real credible options (Threats) to almost Microsoft’s entire product line for almost every size company.
CONTROL
In order make sure their customer’s stay captive in the face of such threats, Microsoft wants to make themselves irreplaceable. The more interwoven they are into the very fabric of a company’s DNA, the more disruptive a vendor or technology change would be. This creates control. Example: Say you’re a CIO of global enterprise with 20,000 employees all running Outlook, Office and Windows, CRM, Server, MySQL, Azure and other key business apps. 6 months before your renewal, Microsoft raises their pricing by 40%. What do you do? You pay it. At this point, you have no other choice. You don’t have to be a mega company either. Smaller companies find themselves in the same conundrum; albeit on a different scale. In short, the more Microsoft products you embed into your business, the less likely they are to negotiate the best prices and terms.
RELEASE CYCLES
To add to the challenges of negotiating the best pricing with Microsoft is their constantly changing products from their licensing bundles and revising usage terms. The fact is, few companies are perfectly aligned with Microsoft’s release cycles; it’s well-known that most tend to lag a cycle or two behind. Microsoft’s pricing structures can be complex and opaque. Some list prices (Microsoft calls them “ERP” – Estimated Retail Price) are published. It’s possible to get competitive reseller quotes for volume licensing programs such as Open and Select Plus, but Microsoft does not publish pricing for the direct-with-Microsoft agreements such as Enterprise License Agreements (ELA). Unless you work with a company that regularly evaluates Enterprise agreements and custom pricing, it is unlikely you would know whether you’re getting the best terms.
MORE IS NOT ALWAYS LESS
It seems perfectly logical to think that if you put all your eggs with Microsoft that you will get a bigger discount and a better per unit price. In negotiating with Microsoft total spend is important, but control can be as important. We have negotiated Microsoft license agreements with a large number of companies ranging from Global Fortune 500 companies to companies with only $50-$100M in revenues. Because we see it all, we have a unique perspective on real market pricing and how things really work. Although contrary to popular belief, companies who are less reliant on Microsoft products tend to pay less per unit than those who are most heavily invested in the Microsoft technology stack. One way to improve your negotiating position is to diversify some of your software platforms. Having all your eggs in the Microsoft technology stack, means you’re likely to pay more per unit in the long run. Provided the solutions fit your needs, it is generally better to have 3-4 more easily replaceable vendors than 1 vendor who already has all your business and knows you’re not going anywhere. In this scenario, the negotiating advantage moves from Vendor to Customer.
BUY ONLY WHAT YOU NEED
Microsoft is notorious for including everything AND the kitchen sink into their deals. The number of SKUs found in an agreement can be overwhelming. Does everyone really need every application? Why pay for every application for every employee if they only use Outlook, Excel and Word. Understanding the needs of the business is important in negotiating deal. We recommend negotiating the best price for all the services and bundles and get detailed cost per SKU figures. Having a good software asset management system prior to negotiations can offer you the detail you need to right size your next ELA. Once established, remove the SKUs you do not need and create additional savings. These license agreement are complex. If you don’t know how all this works, get outside help from a company that does.
ESTABLISH CONTROL
If you are going to start negotiations with Microsoft or a VAR, you need be prepared. To start off, Microsoft has a huge chip on their shoulder. They still have the mentality that all of their customers are captive and thus are not inclined to do anything off book. The most important fundamental strategy in negotiating with Microsoft is to change their perception that you are captive. You need to do your homework first. You should know and be ready to discuss who their key competitors are, pricing models, how the competition is better, faster, cheaper. You should know, how long it would take to transition to a competitor and a high level transition plan. Without violating any Non-Disclosure Agreements, you should have detailed comparative cost models, showing how much vendor A, B & C will save your company and offer a better solution. The more detailed the better. These data points and models are invaluable in negotiations. The fear of lost business is the most powerful way to negotiate special discounts not offered to other companies. More so than with most companies, Microsoft needs to be convinced that they are replaceable. Once established, you will find that Microsoft will be more accommodating in providing special custom pricing.
NEGOTIATIONS
After negotiating over $116M in Microsoft ELAs, and saving clients over $54M, we feel comfortable saying that we are experts on this topic. There is no simple formula to negotiating the best price and the best agreements. Each company has different needs, levels of Microsoft integration and other variables that all need to be analyzed to create a winning strategy. Although I will not go into the more technical aspects of all the different Microsoft licensing options in this blog post, I hope you gained some insight.
We highly recommend getting outside expertise from a company that has done this repeatedly and can help your company avoid the landmines and structure the most advantageous and cost-effective agreements.
If you would like to discuss renewal strategies, or find out if you’re paying too much to Microsoft or any other software, hardware, telecom or mobile services vendors,
How to avoid revenue commitment traps and gain complete control at the negotiating table
A detailed Review of Interval, Attainment and Term Revenue Commitments
After negotiating hundreds of contracts, from dozens of carriers, for clients ranging from global 50 to $50M/year in revenue, I feel I have a unique perspective on this topic. In my experience, I have found that revenue commitments, are to a large extent, arbitrary. Although contrary to popular belief, I regularly find that companies who spend $1M/year will get better rates than companies who spends $10M/year with that same vendor. (I will explain why and how to avoid this phenomenon in another post).
Revenue Commitments Are Designed To:
- Generate predictable revenue streams for carriers
- Insure that the clients are captive customers
- Defend current revenues from would be competitors
- Create significant negotiating advantages at contract renewals
- Increase margins over time
What % Of Your Total Spend Should You Be Willing To Commit?
Vendors would prefer that you commit 100% of your spend… forever. Typically, vendors will come up with a commitment figure that is 80% of your annual spend. We usually recommend that clients commit no more than 60% of their projected spend over the term, not per year. I will demonstrate below why term based commitments are superior and why you would want to stay away from monthly and annual commitments. For an example, I will use a customer that spends $100k/month or $1.2M/year on a 20 site voice and data network.
Interval Based Commitments
These are the most commonly offered terms. Even if a customer spends 10x the sum of all three years commitment, in the first year, the customer will still be liable for the annual commitment in years two and three. These types of commitments are the most restrictive and, if possible, should be enthusiastically avoided. Some of the terms associated with these types of commitments includes:
- MARC – Minimum Annual Revenue Commitment
- Take Or Pay – Either Use A Minimum Amount Or Pay For It Anyway.
- MMRC – Minimum Monthly Revenue Commitment
- MAC – Minimum Annual Commitment
- ARC – Annual Revenue Commitment
The table below demonstrates the one of the most negative aspects of an annual commitment.
| Year 1 | Year 2 | Year 3 | Totals | |
| Monthly Spend | $100,000 | $100,000 | $100,000 | $300,000 |
| Annual Spend | $1,200,000 | $1,200,000 | $1,200,000 | $3,600,000 |
| % Of Annual Commitment | 60% | 60% | 60% | |
| Annual Committed Spend | $720,000 | $720,000 | $720,000 | $2,160,000 |
| Number Of Spend Months Required Each Year To Satisfy Commitment | 8 | 8 | 8 | |
| Number Of Months Remaining Before Auto-Renewal At The End Of The Term | 2-3 |
In this case, the customer has already spent more than the aggregate committed dollar amount by month 21. Since the customer still has the 3rd year commit to satisfy, the customer is stuck for the duration. During year 3, the customer will still have to give the carrier an additional $720K to satisfy the 3rd year annual commitment. In effect, the real commitment ends up being $3.12M. ($2.4M for years 1 and 2 + $720k for year 3) Unfortunately, most of the agreements we see before renegotiating have a 30-60 day auto-renewal clause. By the time your company has satisfied the commitment, there is only 2-3 months left to do anything about it. Since the incumbent knows it can take 4-6 months to move a large data network to another carrier, the customer no longer has any leverage in the form of a credible alternative. Advantage: (Vendor)
Attainment Based Commitments
If interval agreements represent (the stick), attainment agreements represent (the carrot). Attainment agreements create the feeling that you’re not being forced to spend money with the vendor. This is true. However, if not structured correctly, they can be equally restrictive when it comes time to renew an agreement. If the discount tiers and the requirements to reach them are not carefully negotiated, drops in spend or movement of business elsewhere can reduce the discounts enough, on the remaining spend, to be cost prohibitive. ATT and Verizon use both the carrot and the stick. If you sign a revenue commitment with carriers like this, they will be happy to give you huge (60-90%) discounts off their standard tariff prices. Only when the carrier has delayed the renewal proposal long enough to leave you with no other options, you realize that if you do not renew the agreement, your costs will go back up by that same 60-90%. Advantage: (Vendor)
Total Spend Based Commitments
This category of revenue commitment takes into account your total projected spend during the entire contract period. Some of the terms associated with these includes:
- MTRC – Minimum Term Revenue Commitment
- MTM – Minimum Term Commitment
- Burnout – Once total spend is achieved, the commitment is burnt out and gone.
Note: Vendors do NOT like to agree to these. In most cases, the carrier will deny that they have ever offered them. Having the right negotiating strategy is critical. As long as you have someone on your team that has either negotiated these types of commitments before and/or has evidence that the carrier has offered these terms to other companies, you will have a better chance of success.
In this example, the 60% revenue commitments remains the same however, we have removed the annual minimum requirement.
| Year 1 | Year 2 | Year 3 | Totals | |
| Monthly Spend | $100,000 | $100,000 | $100,000 | $300,000 |
| Annual Spend | $1,200,000 | $1,200,000 | $1,200,000 | $3,600,000 |
| Total Committed Spend Over 3 years (60%) | $2,160,000 | |||
| Cumulative Spend | $1,200,000 | $1,200,000 | $1,200,000 | $3,600,000 |
| Number Of Spend Months Required To Satisfy Entire Commitment | 22 | |||
| Number of Months Before Renewal With No Revenue Commitment | 14 |
By taking this approach, the customer satisfies the total $2.1M commitment in month 22 of 36. This means that the customer no longer has any obligation to the carrier, but the carrier is obligated to keep the current rates and terms in place for the next 14 months. The customer is in complete control at this point. Figuratively speaking, the Sword of Damocles is transferred from over the head of the customer to that of the carrier. Negotiating from a position of complete control enables our clients to get better SLAs, terms and pricing than companies with a less favorable negotiating position. Advantage: (Customer)


