optelcon
Pros And Cons of Different Consulting Fee Models (It is all about the incentives)
It’s basic human nature: people are typically driven to do what rewards them the most. This could mean giving back to the community or contributing to the betterment of the human race.
For a business to achieve its goals, incenting employees and vendors correctly is critical. Employees’ and vendors’ goals of success must be in alignment with that of your business’s objectives. If aligned correctly, your employees and vendors will do what is best for themselves, and in doing so, your company will thrive.
The question is then, how to best align the goals of your vendors with that of your profitability goals? When engaging a consulting firm to help improve your company’s profitability, it is vital to understand what their own business drivers are.
There are many ways for consulting companies to bill their clients:
Fee Type |
Profitability Drivers and Key Incentives |
Alignment With Your Company’s Profit Goals |
Predictability | Guaranteed ROI and Increase In Profit |
Risk | Service Is A Profit Center |
| Fixed Fee | Minimize Internal Effort | Limited | High | No | Yes | No |
| Hourly | Maximize Billable Hours | Limited | Medium | No | Yes | No |
| Success Fee | Client Profitability | 100% | Low | Yes | No | Yes |
Although it can be difficult to forecast what you may pay a company with a success fee model, the trade off is better results. Paying your consultants success fees are the only way to truly align your company’s business objectives with those of your vendors. Since the time, investment and effort risk is primarily in the hands of the consultant, not many will charge in this manner. Even fewer companies will only charge clients after the benefit has been realized by their clients. Many charge based on an estimate of savings upfront.
Optelcon is one of the few consulting companies that charges a success fee after the benefit has been received. Optelcon takes the risks because we are confident in our ability to deliver added profits. Your company’s real benifits are:
- A vendor that is a profit center
- A cashflow positive fee structure (fees are charged only after clients receive benefit)
- Converts other vendors’ spend directly into increased profits
- For $3 dollars added to profits only $1 is charged
- Requires minimal internal effort
- Increases Productivity
- Improves Vendor Relationships
- Requires no systems to implement
If working with a company that provides these benefits is something that interests you, please contact us today for a complimentary review of your IT spend.
How Much of Your Mobile Data Usage Is Excessive? Tips to Reduce Your Company’s’ Mobile Data Costs.
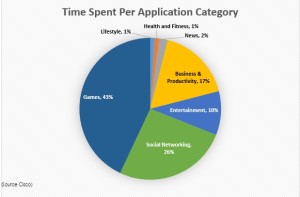
With Smartphones getting smarter and networks getting faster, using your phone to video chat, stream music and binge watch on Netflix is getting easier and easier. In 2012, the average data usage per person was 201MB. In 2015 this number exploded to 1.8GB (A 900% increase). By 2018, this number is expected to exceed 4.7GB/user/month. How people used their phones is equally dynamic. In 2012, people spent an average of 63% of their time using business related apps such as email etc. In 2015, people spent a total of 17% of their time using business and productivity apps. 83% of their time was used on data hungry, non-business related apps.1 The diagram below shows how people use their mobile devices today.
Per Employee, How Much Is Too Much Data Usage?
If your company is paying for your employees’ data, how much data should an average employee use each month on business related applications?
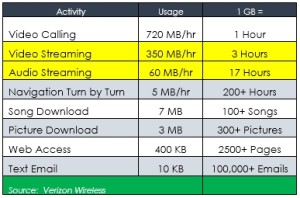
Although the cost per GB has decreased, the demand has increased and is projected to continue to do so. Aside from blocking all non-business related applications, here are some easy tips that can minimize your employees’ data usage and your company’s costs.
Tips To Reduce Your Employees’ Data Usage.
By changing the following settings in your employee’s mobile phones, your company will significantly reduce your data usage and your company’s mobile costs.
1. Always use Wi-Fi when available
It is easy to automatically connect to a secure Wi-Fi network at home or at the office. Just go to your device’s settings, make sure your Wi-Fi is on and log on to the wireless network. Your device will remember the network and log on automatically whenever it’s in range.
2. No video or music streaming unless you’re on Wi-Fi! NO large files.
Media streaming can easily be the most draining activity for your data plan, and you should absolutely avoid it if you’re not connected to a Wi-Fi network.
3. Monitor and turn off data hungry apps
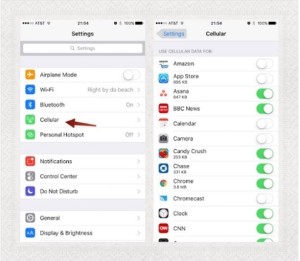
Be sure to prevent unnecessary data hungry apps from using cellular data. On an iPhone, go to Settings – Cellular and toggle them off one-by-one.
4. Shut off your apps
Closing apps when you’re done using them can also reduce data usage. Many open apps—especially those that provide location services—will continue sending and receiving data even when your phone or tablet is locked. This not only wastes data, but can also drain your battery. On an iPhone double click the home button and flick away apps to shut them.
5. Disable Wi-Fi Assist
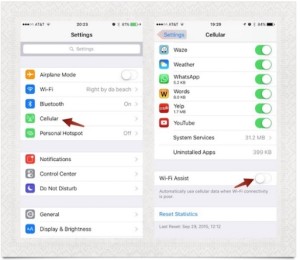
When trying to supplement a weak Wi-Fi signal, Wi-Fi Assist uses Cellular Data to help with bad service. While this does help, you could unknowingly be using a bunch of data. To disable the feature on an iPhone:
- Open the Settings app and find Cellular.
- Scroll to the bottom and slide the toggle for Wi-Fi Assist OFF.
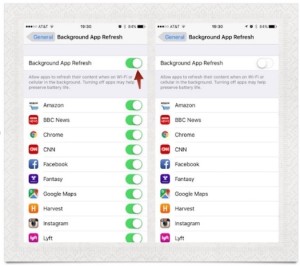
6. Disable Background App Refresh
This is a very common trick to save on data. Apps can update in the background, while you are not using them and this, of course, consumes data. This can be disabled and won’t really affect how you interact with your phone. It also saves battery. On the iPhone:
- Go to Settings -> General and find Background App Refresh.
- Open the menu and disable the function at the top. The apps will go from green to blank.
- You can review the list of apps that had Background Refresh below the toggle.
7. Customize your phone’s auto-backup settings
All popular smartphones these days have features for automatically backing up your data. While this can be great, you should check your relevant app’s settings as soon as possible, and customize them so the app is only allowed to use Wi-Fi for uploading backups.
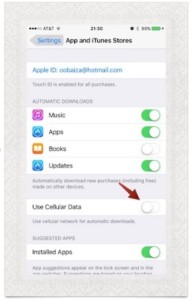
8. Disable Automatic Downloads on Cellular Data
Automatic application updates can use a lot of cellular data. Instead, wait until you are connected to Wi-Fi before downloading and updating your apps.
- In Settings find App and iTunes Stores.
- In the Apps and iTunes Stores section, you’ll see Use Cellular Data. Turn this off and you’re good to go.
9. Disable Video Autoplay on Cellular Network
Some social apps such as Facebook and Twitter have a feature which auto plays videos automatically using a lot of data. To disable Facebook, for example, on iOS devices, go to Settings > Facebook > Settings. Under the Video section, turn on “Auto-play on Wi-Fi only.” On Android devices, go to App Settings from within the Facebook app, then check the box next to “Auto-play videos on Wi-Fi only.”
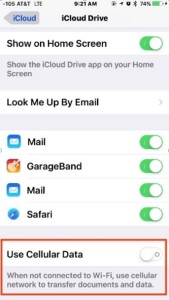
- Turn Off Cellular Data Usage for iCloud
If you use iCloud to move files back and forth between devices, this could lead to higher than usual data usage. Turning this off can help:
- Open Settings and go to iCloud.
- In the iCloud section tap on iCloud once more
- Scroll to the bottom and disable “Use Cellular Data.”
- Last Resort: Avoid using cellular data completely
As a last resort you can turn off cellular data completely.
- Settings -> Cellular
- Turn Cellular Data OFF.
For assistance with these tips and others to reduce your mobile spend, please contact Optelcon at:
Mobility Operations and Customer Care
Email: Email: Mobile Operations
Phone: 877-574-7566
Web: www.optelcon.com
Is Apple taking BYOD to the bank at your company’s expense
Angry Birds, Kool-Aid And The Consumerization Of IT
Back in 2011, Apple coined the phrase the “consumerization of IT”. Today it is just known as BYOD “Bring Your Own (mobile) Device”. Back then, Enterprises would issue their employees devices like flip phones or Blackberrys. In 2011, Apple was already on its 2nd gen phone. The roots of the BYOD movement can actually be traced back to the creation of the App Store. This new concept allowed users to download (productivity) apps like Angry Birds. As the most downloaded iPhone app ever, one could argue that it was addictive games like Angry Birds that really started this revolution. (Come on. You know you played it…) Like a thunder-clap, every research company and news organization started drinking the proverbial Kool-Aid. Before BYOD was really even a “thing”, article after article touted how much money companies were going to save by letting the employees deal with their own mobile phones.

But At What Cost?
Aberdeen conducted a study regarding how cost-effective it was for companies to shift to BYOD. They found that companies with 1,000 BYOD phones spent an average of $170K/year more than organizations that maintained a well controlled corporate environment. The costs where actually shifted to other parts of the organization. The central cost of processing 1-2 invoices shifted to processing 1,000 expense reports. In addition, the IT support costs of managing and securing company data on BYOD devices actually increased. The cost of the equipment decreases comes at the expense of higher service and administrative costs.
Follow The Money To The Bank
How did this happen? It is often said that if you want to find out whodunit, you should “Follow The Money”. If you find out who benefited the most financially, you will likely find your answer. For Apple and others, it’s all about turnover and how fast they can get people to upgrade their old phone to the newest models. It is simple math. Individuals upgrade their mobile phones on an average of 18-20 months. Companies take an average of 28-32 months before they will allow employees to upgrade their phones. Improving turnover by 10-12 months means Billions in additional revenues for Apple and other phone manufacturers. Is it any wonder that Apple and device manufacturers are BYOD’s biggest cheerleaders?
The Tipping Point
According to Gartner, by 2017, over 50% of companies will require that employees use their own devices. BYOD is here to stay.
Best Of Both Worlds

It is possible to get the best of both worlds. One of the latest strategies is to issue corporate SIM cards to employees that are linked to the corporate account. These SIM cards are sent to employees who simply put them into their own devices. There are several advantages to this strategy.
- Employees get the latest and greatest device when they want at their own expense
- Companies retain the company phone numbers after an employee leaves.
- If an employee leaves the company, the employee just swaps out the SIM card to a personal number.
- Companies maintain phone records for compliance purposes.
- Companies save money by maintaining the larger corporate discounts and less expensive plans.
- Expense reports are no longer required. All the charges come in on one bill.
- Lowest cost overall – No equipment charges, lowest plan and administrative costs.
Maximizing Cost Reductions And Achieving Balance

When enterprise companies bring Optelcon in to analyze their mobility spend, our clients’ average domestic monthly smartphone service spend is between $75-$100/month per device. Given this fact, it is easy to see why the idea of giving employees a $50-$75/month reimbursement makes sense. After (re)negotiating our clients’ mobile agreements and optimizing their rate plans, the cost of these same service plans drop to an average of less than $50/month; even less for tablets and Wi-Fi devices. Without the cost of equipment, this hybrid strategy provides the lowest cost without the issues of letting employees own the services plans.
If your company’s average cost per mobile device is higher than $50/month, please contact us for a complimentary corporate mobility spend analysis. You have nothing to lose but wasteful and unnecessary costs.
Click Here For More InfoHow to avoid revenue commitment traps and gain complete control at the negotiating table
A detailed Review of Interval, Attainment and Term Revenue Commitments
After negotiating hundreds of contracts, from dozens of carriers, for clients ranging from global 50 to $50M/year in revenue, I feel I have a unique perspective on this topic. In my experience, I have found that revenue commitments, are to a large extent, arbitrary. Although contrary to popular belief, I regularly find that companies who spend $1M/year will get better rates than companies who spends $10M/year with that same vendor. (I will explain why and how to avoid this phenomenon in another post).
Revenue Commitments Are Designed To:
- Generate predictable revenue streams for carriers
- Insure that the clients are captive customers
- Defend current revenues from would be competitors
- Create significant negotiating advantages at contract renewals
- Increase margins over time
What % Of Your Total Spend Should You Be Willing To Commit?
Vendors would prefer that you commit 100% of your spend… forever. Typically, vendors will come up with a commitment figure that is 80% of your annual spend. We usually recommend that clients commit no more than 60% of their projected spend over the term, not per year. I will demonstrate below why term based commitments are superior and why you would want to stay away from monthly and annual commitments. For an example, I will use a customer that spends $100k/month or $1.2M/year on a 20 site voice and data network.
Interval Based Commitments
These are the most commonly offered terms. Even if a customer spends 10x the sum of all three years commitment, in the first year, the customer will still be liable for the annual commitment in years two and three. These types of commitments are the most restrictive and, if possible, should be enthusiastically avoided. Some of the terms associated with these types of commitments includes:
- MARC – Minimum Annual Revenue Commitment
- Take Or Pay – Either Use A Minimum Amount Or Pay For It Anyway.
- MMRC – Minimum Monthly Revenue Commitment
- MAC – Minimum Annual Commitment
- ARC – Annual Revenue Commitment
The table below demonstrates the one of the most negative aspects of an annual commitment.
| Year 1 | Year 2 | Year 3 | Totals | |
| Monthly Spend | $100,000 | $100,000 | $100,000 | $300,000 |
| Annual Spend | $1,200,000 | $1,200,000 | $1,200,000 | $3,600,000 |
| % Of Annual Commitment | 60% | 60% | 60% | |
| Annual Committed Spend | $720,000 | $720,000 | $720,000 | $2,160,000 |
| Number Of Spend Months Required Each Year To Satisfy Commitment | 8 | 8 | 8 | |
| Number Of Months Remaining Before Auto-Renewal At The End Of The Term | 2-3 |
In this case, the customer has already spent more than the aggregate committed dollar amount by month 21. Since the customer still has the 3rd year commit to satisfy, the customer is stuck for the duration. During year 3, the customer will still have to give the carrier an additional $720K to satisfy the 3rd year annual commitment. In effect, the real commitment ends up being $3.12M. ($2.4M for years 1 and 2 + $720k for year 3) Unfortunately, most of the agreements we see before renegotiating have a 30-60 day auto-renewal clause. By the time your company has satisfied the commitment, there is only 2-3 months left to do anything about it. Since the incumbent knows it can take 4-6 months to move a large data network to another carrier, the customer no longer has any leverage in the form of a credible alternative. Advantage: (Vendor)
Attainment Based Commitments
If interval agreements represent (the stick), attainment agreements represent (the carrot). Attainment agreements create the feeling that you’re not being forced to spend money with the vendor. This is true. However, if not structured correctly, they can be equally restrictive when it comes time to renew an agreement. If the discount tiers and the requirements to reach them are not carefully negotiated, drops in spend or movement of business elsewhere can reduce the discounts enough, on the remaining spend, to be cost prohibitive. ATT and Verizon use both the carrot and the stick. If you sign a revenue commitment with carriers like this, they will be happy to give you huge (60-90%) discounts off their standard tariff prices. Only when the carrier has delayed the renewal proposal long enough to leave you with no other options, you realize that if you do not renew the agreement, your costs will go back up by that same 60-90%. Advantage: (Vendor)
Total Spend Based Commitments
This category of revenue commitment takes into account your total projected spend during the entire contract period. Some of the terms associated with these includes:
- MTRC – Minimum Term Revenue Commitment
- MTM – Minimum Term Commitment
- Burnout – Once total spend is achieved, the commitment is burnt out and gone.
Note: Vendors do NOT like to agree to these. In most cases, the carrier will deny that they have ever offered them. Having the right negotiating strategy is critical. As long as you have someone on your team that has either negotiated these types of commitments before and/or has evidence that the carrier has offered these terms to other companies, you will have a better chance of success.
In this example, the 60% revenue commitments remains the same however, we have removed the annual minimum requirement.
| Year 1 | Year 2 | Year 3 | Totals | |
| Monthly Spend | $100,000 | $100,000 | $100,000 | $300,000 |
| Annual Spend | $1,200,000 | $1,200,000 | $1,200,000 | $3,600,000 |
| Total Committed Spend Over 3 years (60%) | $2,160,000 | |||
| Cumulative Spend | $1,200,000 | $1,200,000 | $1,200,000 | $3,600,000 |
| Number Of Spend Months Required To Satisfy Entire Commitment | 22 | |||
| Number of Months Before Renewal With No Revenue Commitment | 14 |
By taking this approach, the customer satisfies the total $2.1M commitment in month 22 of 36. This means that the customer no longer has any obligation to the carrier, but the carrier is obligated to keep the current rates and terms in place for the next 14 months. The customer is in complete control at this point. Figuratively speaking, the Sword of Damocles is transferred from over the head of the customer to that of the carrier. Negotiating from a position of complete control enables our clients to get better SLAs, terms and pricing than companies with a less favorable negotiating position. Advantage: (Customer)


